
Performance Page - Overview
Using our patented algorithms, we can accurately determine how well your system should be performing. By using the Performance page, it lets you know if your solar system is operating as expected.
You can access the Performance page by clicking on the “Performance” tab on left side of the dashboard.
Overview of the Performance Page
Section titled “Overview of the Performance Page”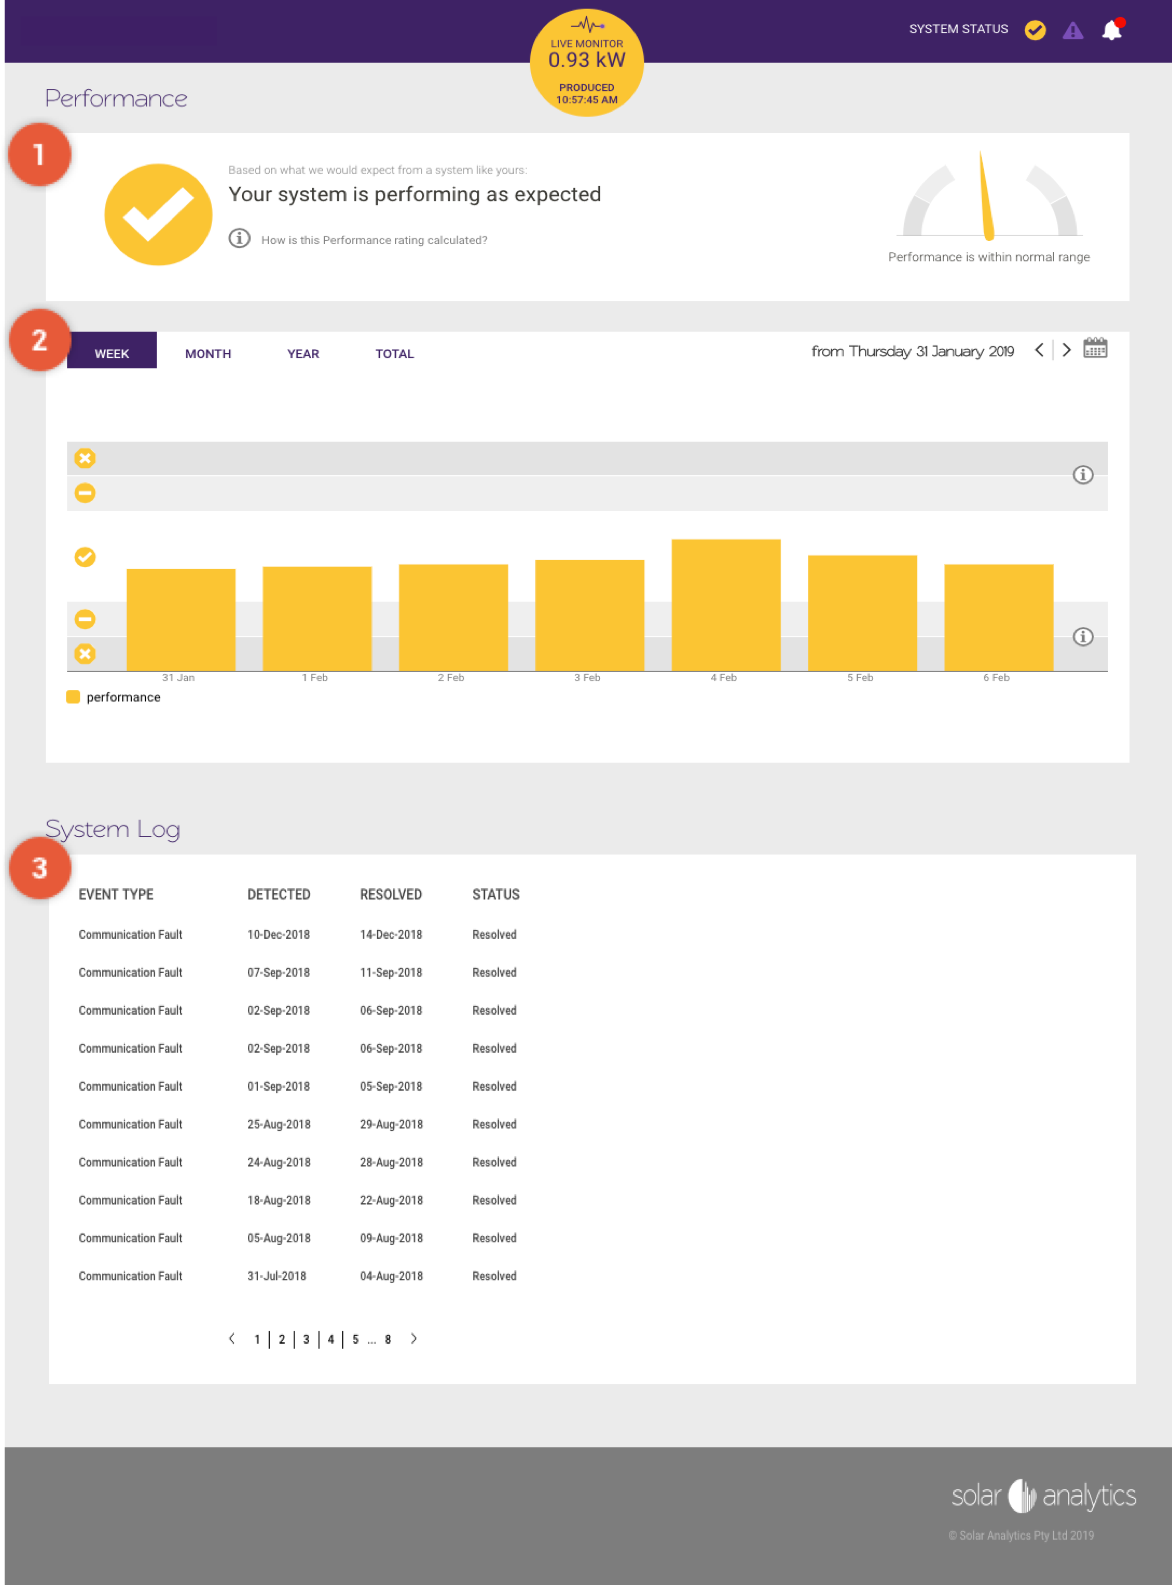
 Performance Status
Section titled “ Performance Status”The status in this section shows whether your system is performing as expected.
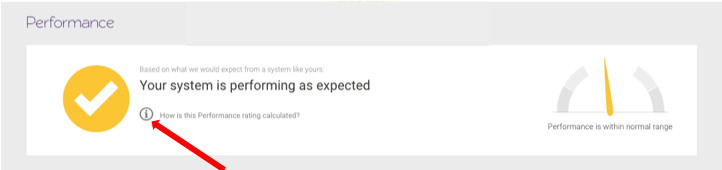
For an understanding of the calculations behind your performance rating, click on the  icon.
icon.
 Overview of Your System Performance
Section titled “Overview of Your System Performance”The performance percentage dial indicates how well your system is performing in comparison to what we would expect.Various regions of the performance graph are represented by the following:
 = Your system is performing withinthe normal expected range.
 = Your system is performing a little bit above/below the normal expected range.
 = Your system is performing significantly above/below the normal expected range.
In the below example, data is shown on a weekly basis. You can click on the ‘MONTH’, ‘YEAR’ or ‘TOTAL’ buttons to change this.
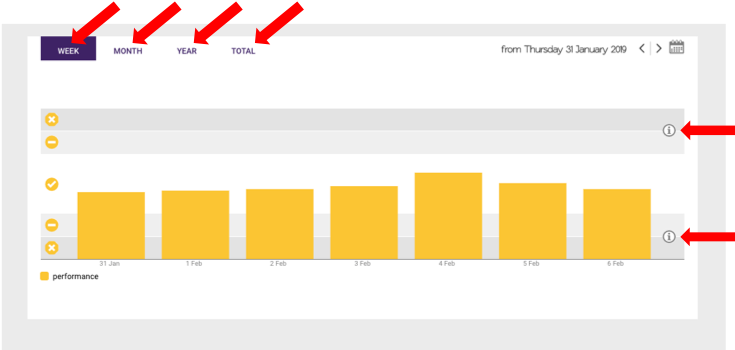
Click on the
icon to find out more information on how this is calculated and what you can do.
Specific dates can be selected by clicking on
and
icons.
Note:
- If your site is performing abovethe normal range, this means your system is ‘over-performing’. For more information visit our over-performance page.
- If your site is performing belowthe normal range, this means your system is ‘under-performing’. For more information visit our under-performance page.
 System Log
Section titled “ System Log”In this section, you can view the log of fault events which your solar system and Monitoring Hardware currently has or had in the past. This includes when your:
- Solar system has stopped generating. For more information visit our Zero Production Fault page.
- Monitoring Hardware has stopped communicating. For more information visit our Communications Fault page.
< PRO TIP >
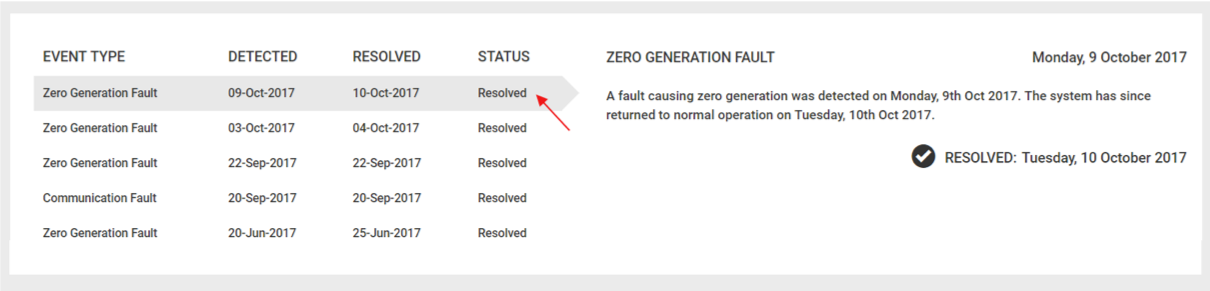
You can click on the Event Faults to see more information on the fault detected.