

Live Monitor - Overview
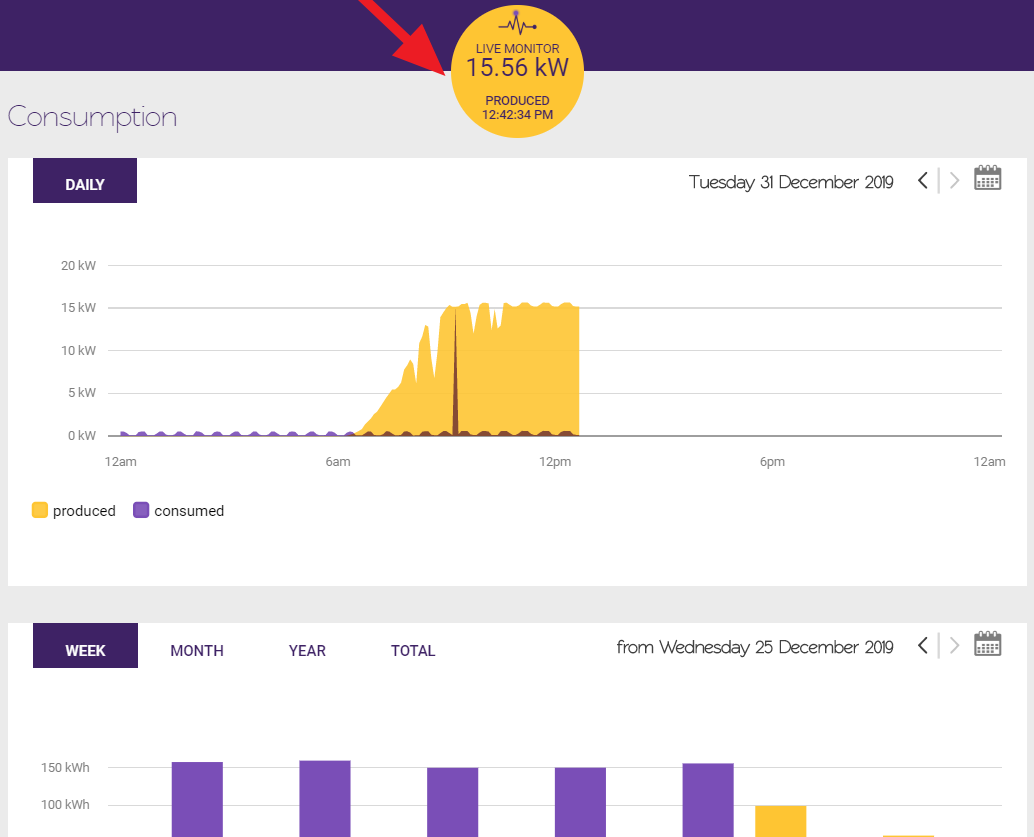
On the Solar Analytics dashboard, you may have seen this yellow/purple circle that flips every 15 seconds with values on it.
- The Live Monitor is only available for Wattwatcher-integrated sites and not available for OEM-integrated (sites with Sungrow, Fronius, Goodwe, GE Solar or LG integrated) or CATCH-integrated sites.
- To note the difference between the sites above, please visit our website here
Where can I find Live Monitor?
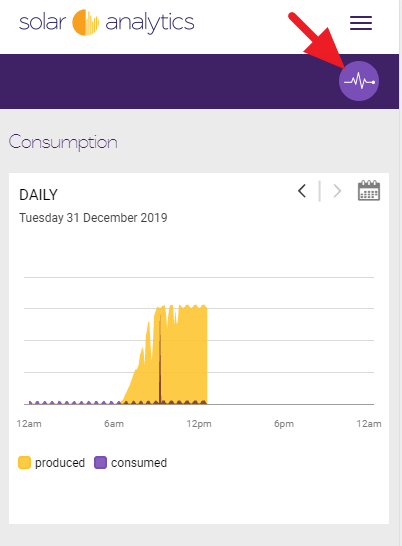
Section titled “Where can I find Live Monitor?”On the desktop, Live Monitor can be found on the top middle of your screen. On the mobile, it can be found on the top.
Desktop view
Mobile view
What does it say?
Section titled “What does it say?”As mentioned previously, the Live Monitor flips every 15 seconds. It is showing either your Solar PV Generation or Consumption or both.
| Overview (Live Monitor) | Yellow means it is showing the amount of energy that your Solar PV system is currently generating. |
| Overview (Live Monitor) | Purple means it is showing the amount of energy that your currently consuming whether from Solar PV Generation and/or the Grid. |
Data resolution
Section titled “Data resolution”The Live Monitor button can be expanded into the Live Monitor graph by clicking it. The Live Monitor Graph presents the energy data at your site for the last 60 minutes. Please refer to the image below.
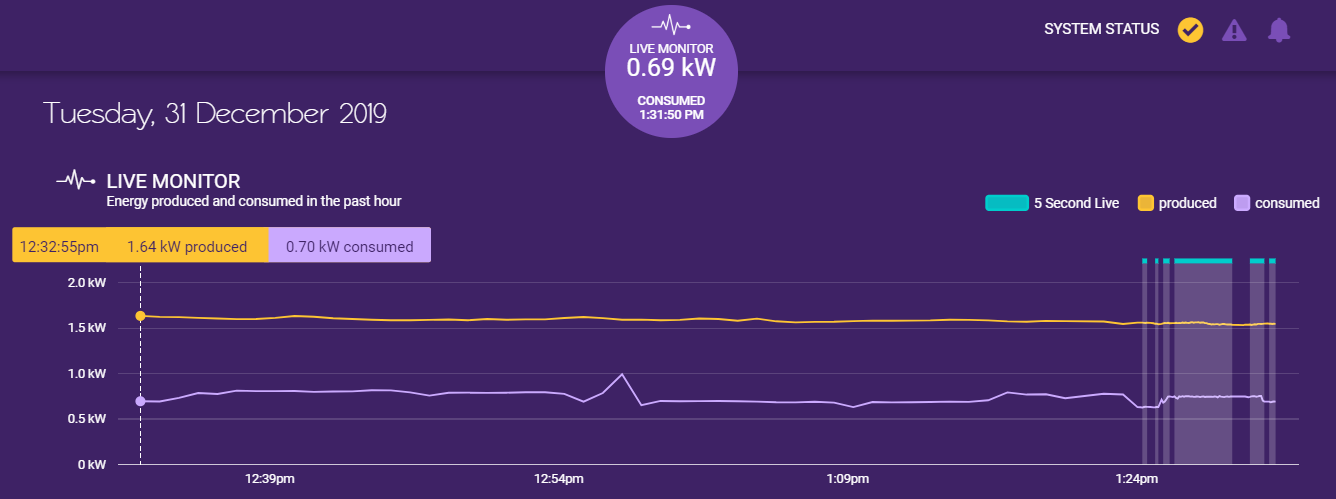
In default, the Live Monitor records data every 1 minute. However, the 5-second live mode on the Live Monitor is enabled the moment you visit the dashboard and will last for 10 minutes. The 5-second live mode is indicated by the light grey shaded regions as shown in the image above. Please try to refresh the page if the 5-second live mode doesn’t kick in after 30 seconds of visiting the dashboard.
Please try to refresh the page if the Solar PV Generation and the Consumption graphs appear to be mirroring one another. Otherwise click Contact Us below if the issue persists.
My Live Monitor is not there
Section titled “My Live Monitor is not there”If you are unable to see the Live Monitor, it can be caused by several things:
- You are not using the latest internet browser
We recommend using Google Chrome to visit the Solar Analytics dashboard to ensure you have the best experience. Click here to download Google Chrome. - Do you see this symbol
 on your dashboard?
This means that the device has ceased to communicate to the server. Please try to follow the troubleshooting instruction on this link .