

Savings Page - Overview
You are probably curious how much money you are saving from your solar system and how much you have spent on your grid usage, the Savings page is your go to page to find out whether you are making the most out of your solar investment.
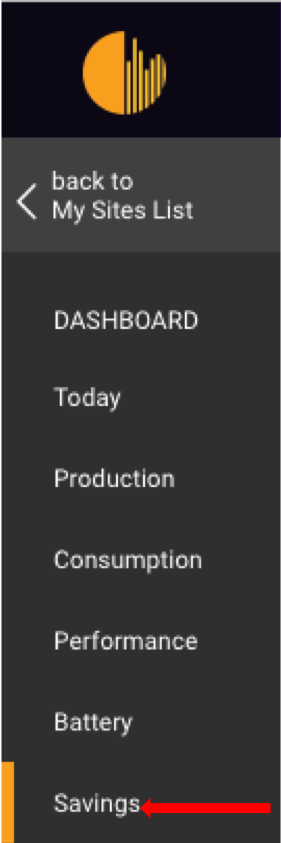
You can access the ‘Savings’ page by clicking on the “Savings” tab on left side of the dashboard.
To ensure that you are viewing the right information on this page, please ensure that you have inputted the right Tariffs on your “My Tariff” page. For more information on this visit our support page
If you’re outside Australia, please check this important information
 Total Savings and Expected Savings
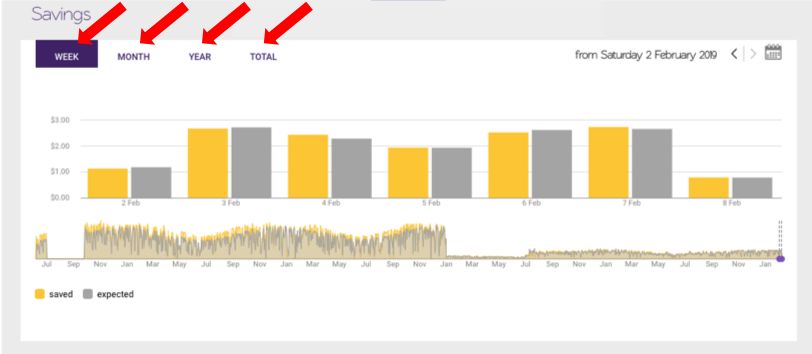
Section titled “ Total Savings and Expected Savings”Saved: total amount saved in $ per day.
Expected: total amount expected to save in $ per day.
In the below example, data is shown on a weekly basis. You can click on the ‘MONTH’, ‘YEAR’ or ‘TOTAL’ buttons to change this.
Date range can be selected by clicking onto the
icon.
 Savings Breakdown
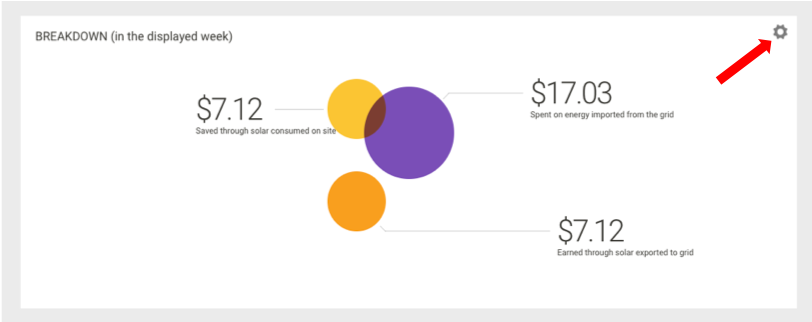
Section titled “ Savings Breakdown”In this section, you can view the savings breakdown in $ in the selected date range  for:
for:
- Solar consumed on site (saved)
- Energy imported from the grid (spent)
- Solar exported to the grid (earned)
Date range can be selected by clicking onto the
 Total Savings
Section titled “ Total Savings”Savings is the total amount saved in $ in the selected date range .
Your savings is calculated by:
Savings =(kWh consumed on site from solar production x your import tariff) + (kWh exported x the export tariff)
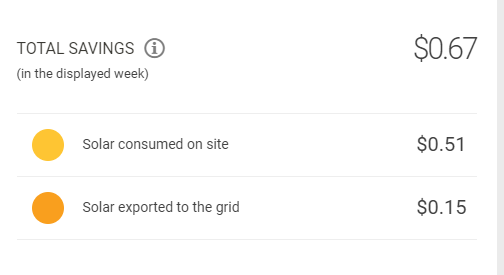
For more information about how total savings are calculated click on the
icon.
You can update your import and export tariffs by clicking on the
icon in the Total Savings box.
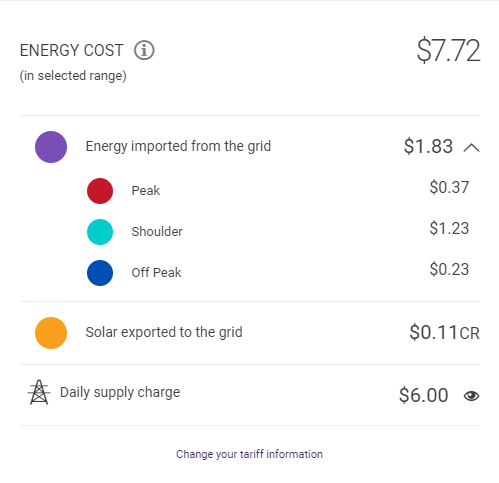
 Energy Cost
Section titled “ Energy Cost”Energy Cost in $ is displayed in the selected date range .
Your energy cost is calculated by:
Energy Cost =(kWh imported from the grid x your import tariff) - (kWh exported to the grid x your export tariff)
You can also get the breakdown of your TOU by clicking on the drop-down icon next to ‘Energy imported from the grid’ as per the screenshot below.
If you choose not to include the Daily Supply Charge by clicking the ‘eye’ icon, we calculate your savings is as follows:
Energy Cost =(kWh imported from the grid x your import tariff) - (kWh exported to the grid x your export tariff)
For more information about how Net Spend is calculated click on the
You can update your import and export tariffs by clicking on the
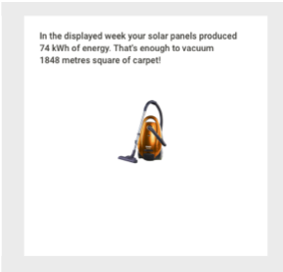
 Fun Fact
Section titled “ Fun Fact”Here we provide you with fun facts enabling you to compare your weekly solar production to energy use in everyday habits!
To compare your electricity bills with Solar Analytics dashboard, please check here