
Production Page - Overview
If you have a solar system or multiple systems that are monitored by Solar Analytics, you will have access the ‘Production’ page where you can view how much your system has been generating since the monitoring start date.
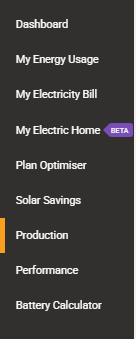
You can also access the Production page by clicking on the “Production” tab on left side of the dashboard.
Overview of the Production Page Overview (Production Page)
Section titled “Overview of the Production Page Overview (Production Page)” Daily Production
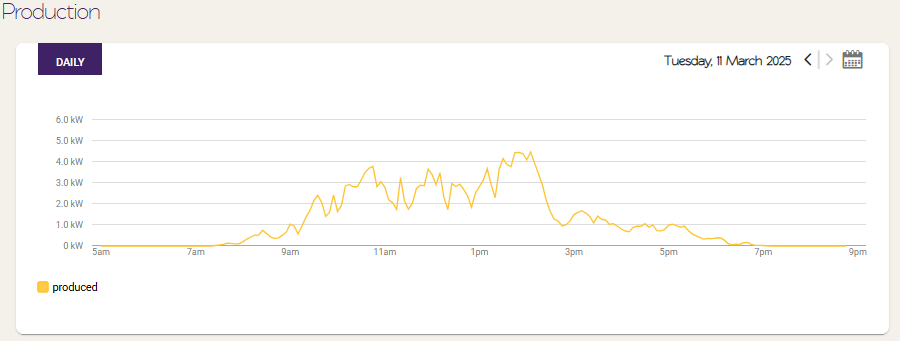
Section titled “Daily Production”Your production graph. Here we display the energy (kW) your solar system has produced in 5 minute intervals.
The production data for a specific date can be selected from  and
and  icons
icons
 Total Energy Daily Production
Section titled “Total Energy Daily Production”Produced: total energy produced from your solar system in kWh per day.
**Expected:**total energy we expect your solar system to produce from your solar system in kWh per day.
Lost to shading: predicted loss due to shading. Click on  or visit our Shading Algorithm page to find out more on how this is calculated. In the below example, data is shown on a weekly basis. You can click on the ‘MONTH’, ‘YEAR’ or ‘TOTAL’ buttons to change this.
Production - Total Energy Daily Production.png
Section titled “Production - Total Energy Daily Production.png”Date range can be selected by clicking onto the icon.
Note:
To hide a circuit click on the corresponding coloured icon. For example to hide total energy produced, click on the
icon.
 Total Production
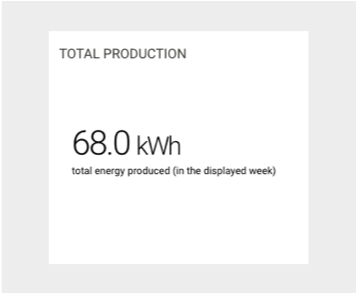
Section titled “ Total Production”Total production is the total amount of energy produced from your solar system in kWh in the selected date range .
Date range can be selected by clicking onto the
 Savings
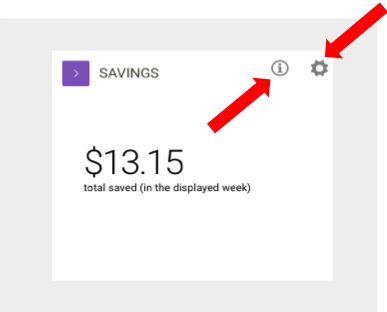
Section titled “ Savings”Savings is the total amount saved in $ in the selected date range .
Your savings is calculated by:
Savings = ( kWh consumed on site x your import tariff ) + ( kWh exported x the export tariff )
For more about savings click on the
You can update your import and export tariffs by clicking on the
icon in the Savings box.
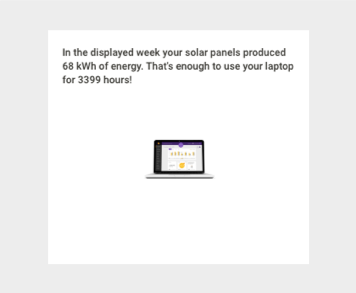
 Fun Fact
Section titled “ Fun Fact”Here we provide you with fun facts enabling you to compare your weekly solar production to energy use in everyday habits!