

How does our shading algorithm work?
Four weeks after the Solar Smart Monitor is installed you will be able to log in to the Dashboard to see how much solar energy you are losing to shading and at what time of the day.
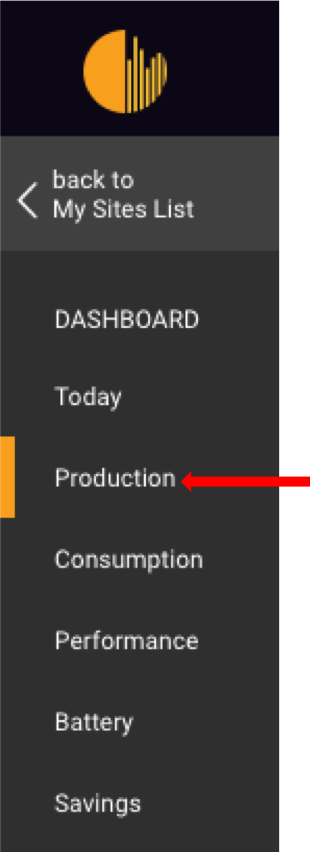
Shading can be observed on our Production page on the dashboard.
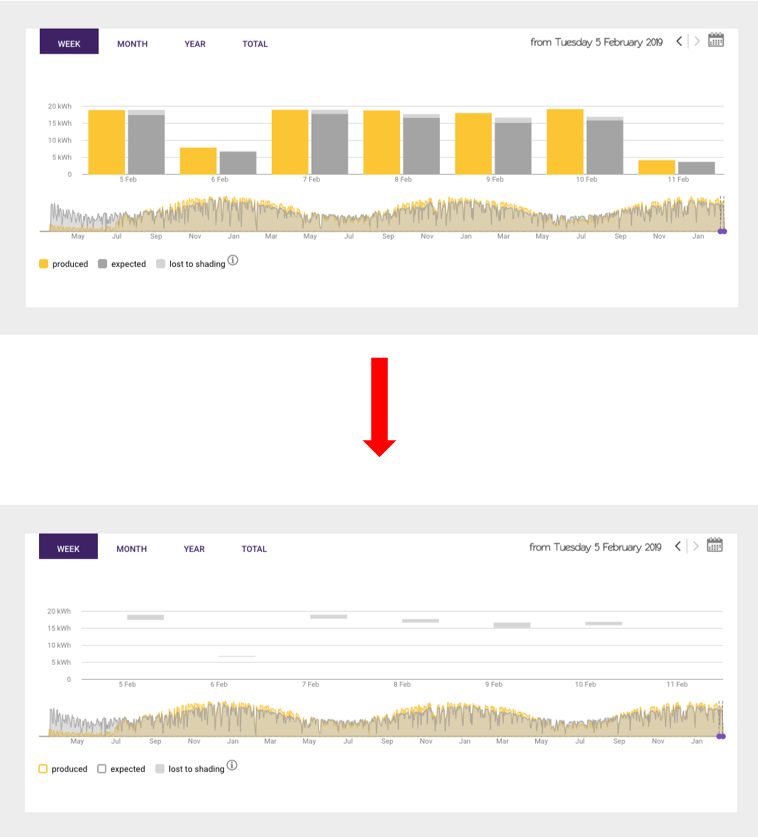
Our Total Energy Daily Production graph (2nd from the top) displays shading in light grey  . By clicking on the
  and
and  buttons you can hide energy produced and consumed respectively to view solely that lost to shading
This is one of our newest features and we are happy to say that no other solar monitoring solution can provide this kind of information.
© 2026 CATCH Power & Solar Analytics