

Alerts Page
Alerts Page
Section titled “Alerts Page”The Alerts Page is designed to make supporting your customer faster and easier! It is a single page that lists out all sites with issues, helping you to understand the triggers, how to resolve them, and track the site’s status. This page shows all the features of the new page and how to use them.
Access & Function
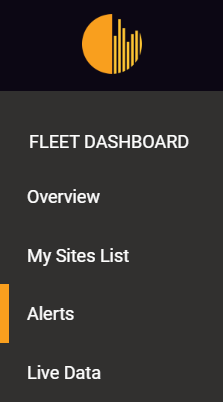
Section titled “Access & Function”The Alerts Page is accessible by logging in to your Solar Analytics Fleet Dashboard >> Alertsvia ‘My Solar’ app or web browser:https://my.solaranalytics.com/au/fleet/alerts/
The page is located below ‘My Site List’ as below:
The Alerts Page contains useful information regarding:
- Fault that’s occurring on-site, date detected, and the impact of the issue
- Site status (If it requires attention/checking/waiting on the progress), site details, and owner’s information
- Possible causes of the issue
- Action required by Solar Retailer and Site Owner
- Troubleshooting steps
Overview - Browser and Mobile View/App
Section titled “Overview - Browser and Mobile View/App”- The general overview provides brief information on the site status and details, fault type, and how long it has occurred.
- Scroll through pages with the arrows at the bottom or search for a specific site using the ‘search’ bar.
- Site status (Attention, Investigate, Resolved) filter is available for filtering the sites based on site status.
On the web view, you can also choose to sort by a range of columns. By default, it orders them by site status priority.
The page is broken down into two sections - ‘New Alerts’ and ‘Active Alerts’ to help you distinguish the alerts you have seen and have not seen.
- New Alerts - lists all the new alerts. It is equipped with ‘I’ve seen this button’ which can be clicked to mark the current alert as viewed and it will be moved to ‘Active Alerts’ section
- Active Alerts - lists all the currently active alerts that you’ve marked as viewed. You are able to move this as a new alert by clicking ‘Mark as New’
Web Browser view
Section titled “Web Browser view”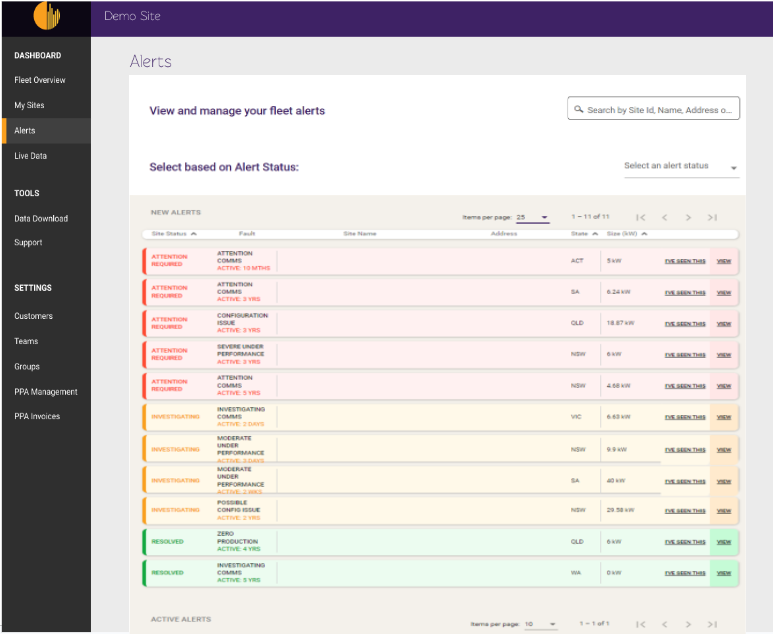
Mobile View or App
Section titled “Mobile View or App”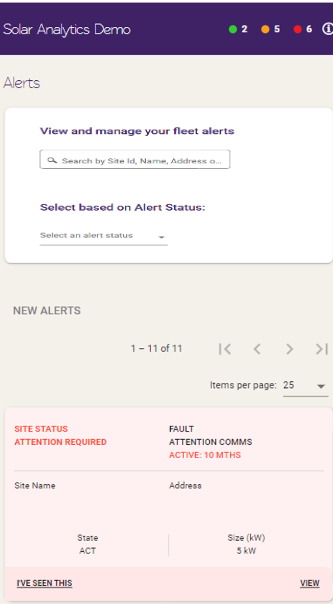
A more detailed breakdown of the alerts can be seen by clicking the**‘View’** button:
- Fault Diagnosis - Contains information of when the issue was detected, possible causes, and the impact. More detailed information about the possible causes is provided on the table by clicking ‘See possible causes for this issue’
- Action Required - This section advises what is required from the Solar retailer and the Site owner. The troubleshooting steps are accessible by clicking ‘See how to resolve this issue’
- Site Details - This part comprises basic site information and the owner’s contact details. More detailed information can be found on the customer’s site ‘Go to Dashboard’
Web Browser view
Section titled “Web Browser view”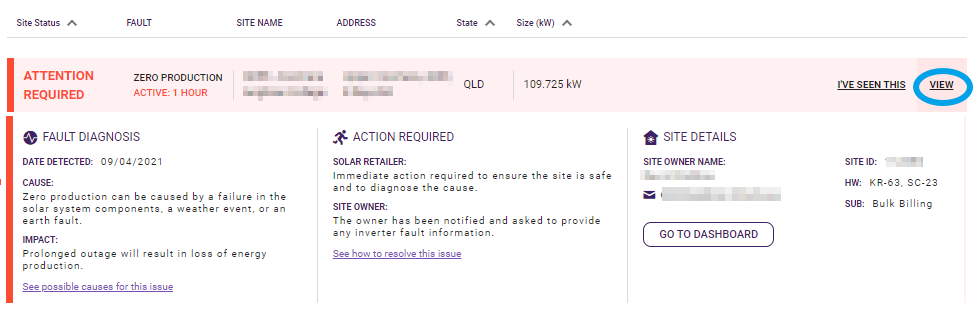
Mobile View or App
Section titled “Mobile View or App”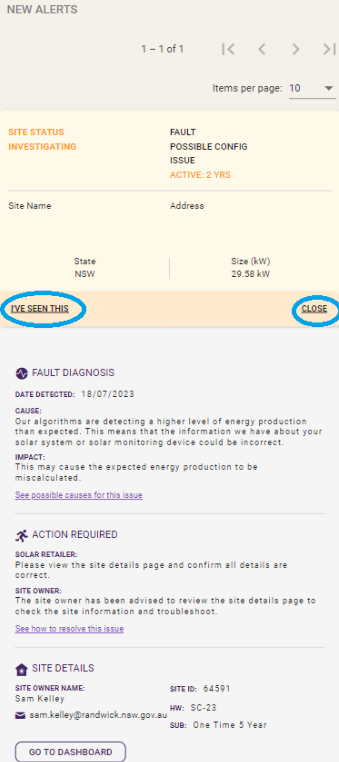
Types of Alerts and Causes
Section titled “Types of Alerts and Causes”| Alerts Type | Alerts page Status | What does it mean? | Possible Causes |
| Zero Production Fault | Attention required | The solar system has stopped producing energy at a time when it is expected to | What causes a ‘Zero Production’ issue? |
| Communication Offline | Attention Required (>=7 days) Investigating (< 7 days) | The monitoring hardware or Sungrow inverter API connection has stopped communicating with Solar Analytics | What causes a ‘Communication Offline’ issue? |
| Configuration Issue | Attention required | When registering the device on Solar Analytics, a mistake was made in the system details | What causes a ‘Configuration’ issue? |
| Possible Configuration Issue | Investigating | When commissioning the device on Solar Analytics, there may have been a mistake made in the system details | What causes a ‘Possible Configuration’ issue? |
| Severe underperformance | Attention required | The system is producingfar less energy than expected. | What causes a ‘Severe Under-performance’ issue? |
| Moderate underperformance | Investigating | The system is producing slightly less energy than expected. | What causes a ‘Moderate Underperformance’ issue? |