

Live Data
Live Data
Section titled “Live Data”Live Data shows data in higher resolutions. Please see below screenshot for more information:
Access this page by clicking on the “Live Data” button from the fleet dashboard.
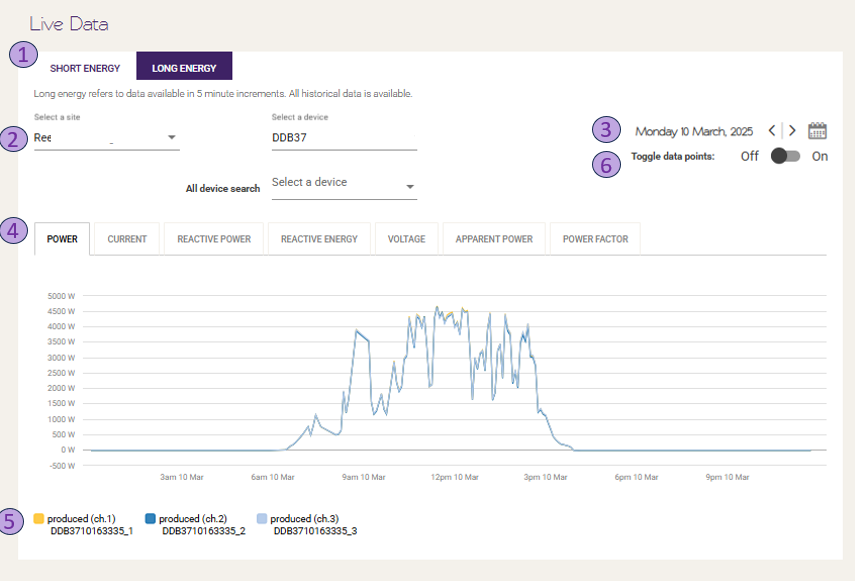
- Choose an energy resolution:
- Short Energy - 60 second data (5 second data displayed for 8 minute periods)
- Long Energy - 5 minute data
- Select your site by typing in your Site Name or Site ID or the serial number of the SolA device.
- Select a specific day to view (only available in Long Energy)
- Select the type of reading
- Circuit label(s) - By clicking the circuit label(s), circuits on the graph can be filtered.
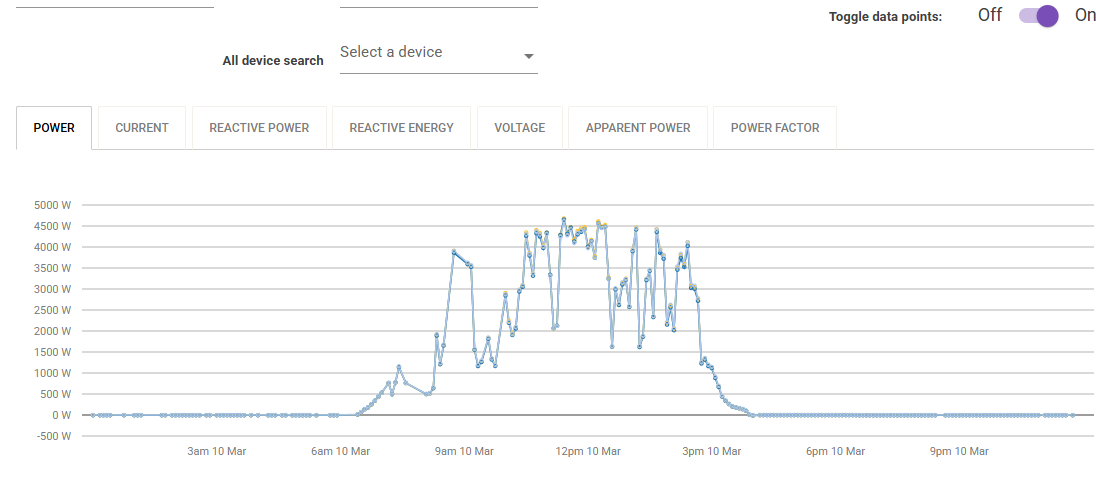
- Toggle points to be switched on to see each data point
-
Commonly Asked Questions:
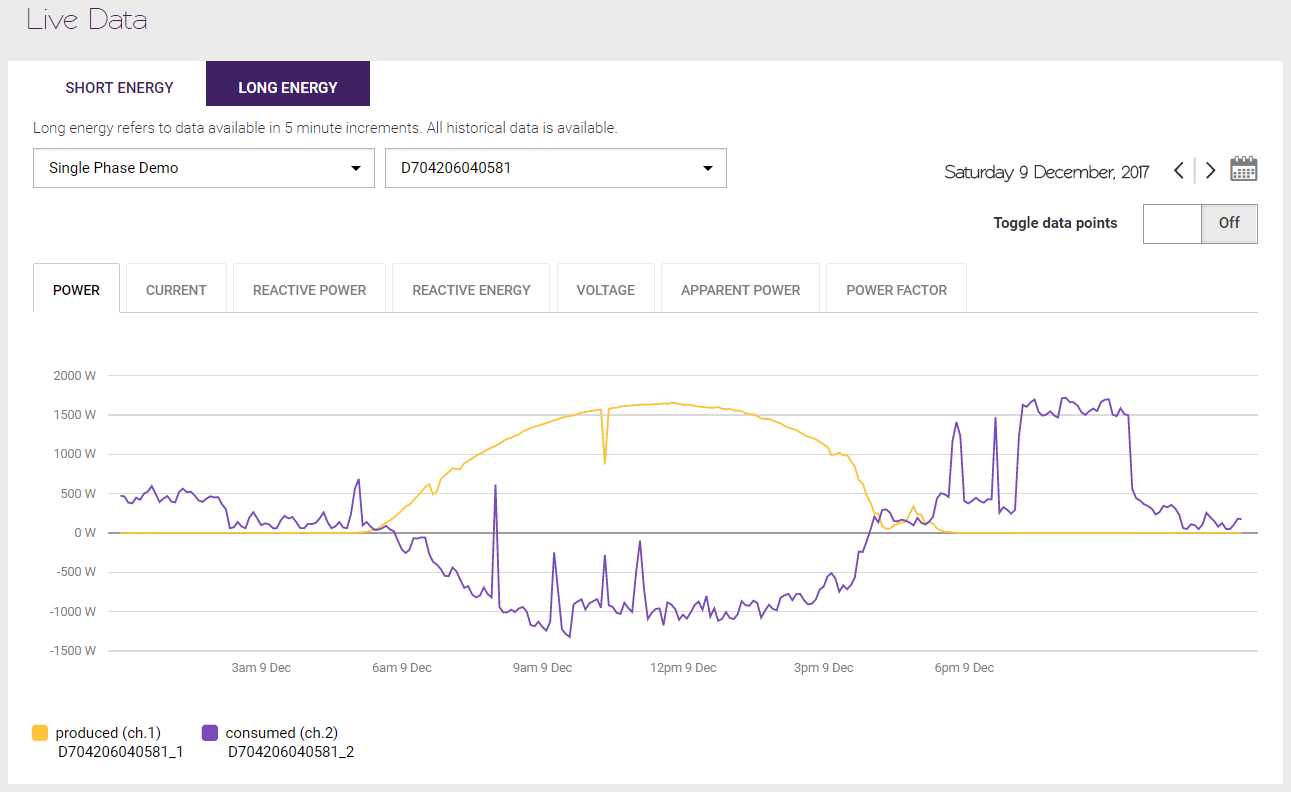
Section titled “Commonly Asked Questions:”Why is my consumption graph showing below 0W?(please see the screenshot below):
If the consumed graph is in the negative region, it means energy is exported to the grid.
Please note, the way in which consumption data is displayed here differs from that on the Customer Dashboard. To learn how to interpret the consumption graphs on the Customer Dashboard, please visit: My Energy Usage Page.
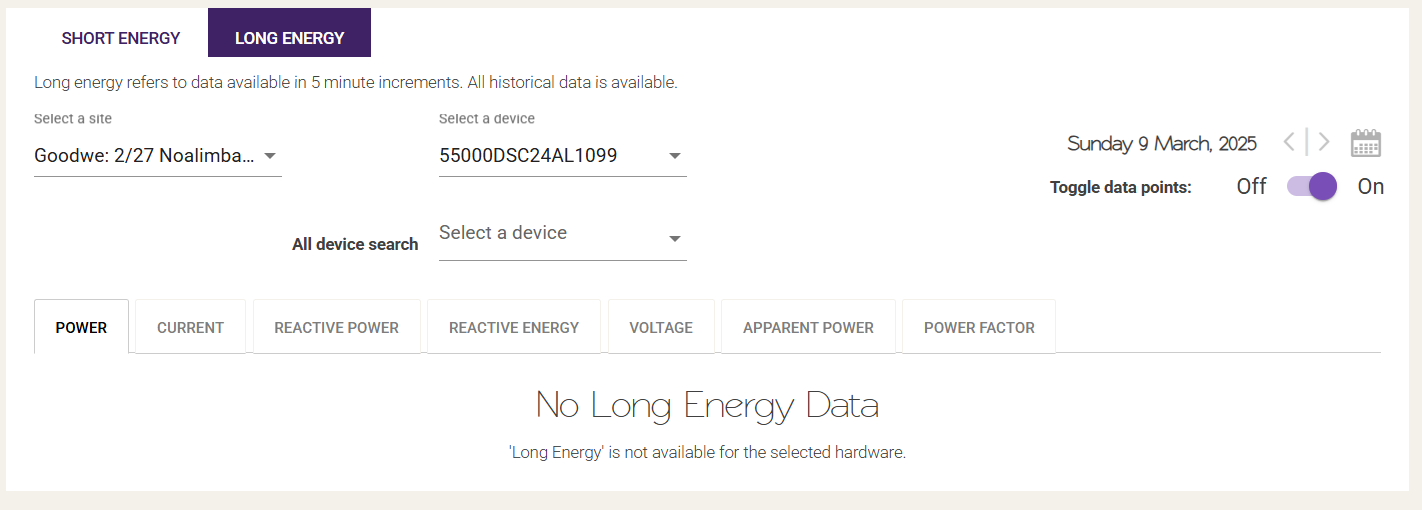
Would I have access to Live Data if my site is an integrated site?
OEM-Integrated (Sungrow, Fronius, Goodwe / GE Solar, LG integrated) sites will not have access to Live Data’s Short Energy and Long Energy data.
Please explain more regarding the differences between Long Energy and Short Energy?
LE will be an average over the 5 minute period. Conversely SE is the 5 sec data. It is a fair bit below on SE for the first part of the 5 min period, LE is a bit lower as it averages out the current so it makes sense for the 5 min period. The bottom line is, the aggregation is different.
One is the average current over 5 mins, one is the current over 5 secs. So to get them to line up you would need to take the average of all
the 5s data points in the 5 min period and not the instantaneous point where the timestamps happen to line up.
Why non power measurements are not recorded?
Non-power measurements are only collected for Short Energy when the “5 seconds interval” data button is pressed. It is otherwise not collected. For the other fields (current, frequency etc.), the customer/installer will need to request it either from the live data page or click the live data button on Dashboard. Otherwise they are not recorded.’