

Data Download
Data Download
Section titled “Data Download”Which Solar Analytics Data Download is right for me?
Section titled “Which Solar Analytics Data Download is right for me?”Solar Analytics currently offers several versions of data downloads as CSV files to suit deeper analysis.
Owner Data Downloads are limited to basic information, Fleet owners have access to more detailed technical and diagnostic information.
IMPORTANT NOTE due to privacy restrictions set down by the ACCC, owners who use Integrated+ (retail meter consumption data via CDR) can download data, but Fleet owners cannot.
Where to find Data Downloads?
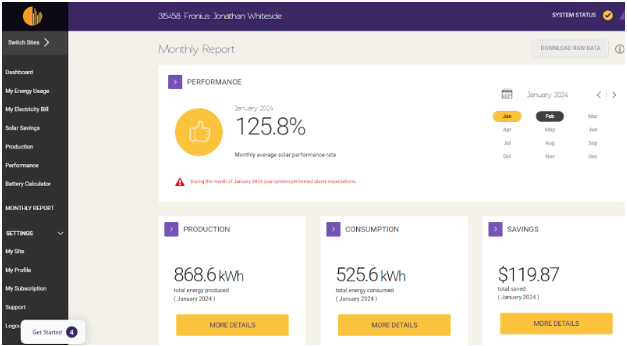
Section titled “Where to find Data Downloads?”Site owners can find the Data Download feature in the dashboard under the MONTHLY REPORT (1) tab. Once selected, select the ‘Month’ on the field indicated (2) and await your email to download data. Please refer to the image below.
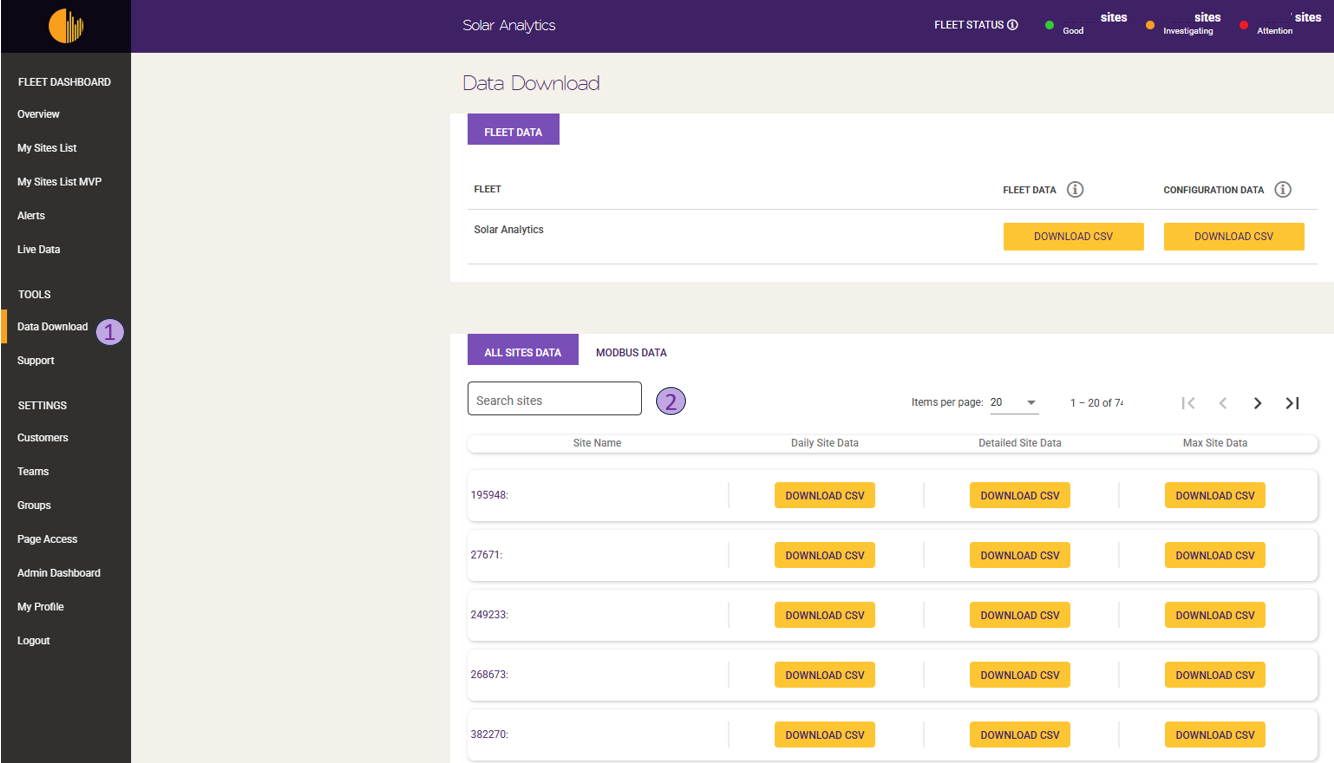
Meanwhile, the ‘Data Download’ (1) feature can be located on the Fleet Dashboard navigation panel. Once selected, type in the ‘Site Name’ on the field indicated (2). Please refer to the image below.
Types of Reporting:
Section titled “Types of Reporting:”1. Daily Site Data
Section titled “1. Daily Site Data”Daily Site Data is ideal for a quick overview of energy measurements and for assessing actual versus expected system performance. It is also useful as a base data set for additional calculations such as excess daily energy. This data consists of all historical data since the day the site was installed
This data is available in two locations:
- The End User dashboard, under the “Monthly Report”
- The Fleet dashboard, under the “Data Download” menu titled “Daily Site Data”
This data set includes:
- Gross daily energy generated (kWh)
- Gross daily energy consumed (kWh)
- Gross daily energy expected (kWh)
- Gross daily sub circuit consumption (kWh)
2. Detailed Site Data
Section titled “2. Detailed Site Data”Detailed site data is a more detailed MONTHLY data set and is only available to Fleet Owners. Select “Detailed Site Data” in the Data Download menu
It is a representation of what appears on the Consumption graph of the end user dashboard and aggregates all consumption data into a single data set. If more than one inverter is present, all solar output will also be aggregated into a single generation data set.
This data is useful for analysis of demand profiles, self-consumed energy and exported energy. It is provided in five-minute data and time-stamped increments. This report provides all historical data as a total data set since the system was commissioned.
The data set includes::
- Energy Generated (Wh)
- Energy Consumed (Wh)
- PV Energy Consumed (Wh)
- PV Energy Exported (Wh)
- Grid Energy Imported (Wh)
3. Max Site Data
Section titled “3. Max Site Data”Max data is the most detailed MONTHLY data set and is only available to Fleet Owners. Select “Max Site Data” in the Data Download menu
This report uses raw data, measured by the devices and channels on site. The report is presented in five-minute data and time-stamped increments. It includes majority of data that can be viewed in the Fleet Dashboard under the “Live Data - Long Energy” tab and is most useful for highly detail analysis. It is useful in assessing network voltage and peak demand.
Importantly, it should be noted that this data is raw and may include negative values. If solar is installed, the total site consumption will appear as Net load (rather than gross) i.e. negative values will represent excess solar exported to the grid.
The report shows:
- Connection ID
- Device name
- Connection name
- Watt Device ID
- Polarity
- Connection enabled
- Connection Type
- Energy per channel (Wh)
- Power per channel (W)
- Energy Reactive (VArs)
- Max Current (A)
- Min Current (A)
- Max Voltage (V)
- Min Voltage (V)
- Energy Positive (Wh)
- Energy Negative (Wh)
4. Fleet Data
Section titled “4. Fleet Data”Fleet data is a highly detailed snapshot in time of the key details of all sites in your Fleet.
It is ideal for analyzing and sorting sites for a variety of purposes including:
- Understanding the potential savings for owners who have calculated savings potential from Plan Optimiser calculations to run campaigns
- Sorting and filtering based on current site performance status, fault type or dashboard status to run support activities
- Understanding which owners have lapsed subscriptions or pending subscription renewals to run campaigns
- Sorting and filtering by a wide variety of customer, system, geographic or other details to target various activities
The data download shows:
- Site ID
- Site Name
- Street Address
- City
- State
- Postcode
- Country
- DC Rating (kW)
- AC Rating (kW)
- PV Install Date
- Site Type
- Site Commissioned Date
- Current Subscription Type
- Current Subscription Type Start
- Current Subscription Type Length (days)
- SA Next Renewal Date
- SA Subscription Status
- Payment Platform
- SA Subscription Notes
- Monitoring Hardware
- Owner Surname
- Owner Firstname
- Owner Email
- Installer Company
- SA Reseller
- Owner Activation Status
- Dashboard Status
- Performance Status
- Fault Type
- Fault Duration (days)
- PPAorCash
- Hardware Count
- Inverter Count
- PO Status
- PO Savings
- PO Calc Start
- PO Calc End
- Site Has Active Devices
5. Configuration Data
Section titled “5. Configuration Data”Fleet data is also a highly detailed snapshot in time of the key details of all sites in your Fleet, but focused on key technical and system configuration information such as PV and inverter brand and sub array orientation.
It is ideal for sorting and analyzing your sites from a technical and configuration point of view.
The data download shows:
- Site ID
- Site Name
- Street Address
- City
- State
- PV Install Date
- SA Subscription Type
- SA Subscription Notes
- SA Subscription Start
- SA Subscription Length
- SA Next Renewal Date
- Monitoring Hardware
- Owner Surname
- Owner Firstname
- Owner Email
- Installer Company
- SA Reseller
- SA Monitoring
- Current System Status
- Site Comment
- PPAorCash
- Inverter Manufacturer
- Inverter Model
- Inverter AC Rating (kW)
- Subarray Manufacturer
- Subarray Model
- Subarray Orientation
- Subarray Tilt
- Subarray Strings
- Subarray Modules per String
- Subarray DC Rating (kW)
How does a report get sent?
Section titled “How does a report get sent?”Once you have selected the type of data you would like to download, a link will be sent to your email address. Please note that the link is sent to the email address that you use to access the Solar Analytics dashboard. It may take our server up to 15 minutes to get the link ready and will it will expire if not used in the following hour.
If you do not receive the file to your email within 15 minutes, please check if your server blocks any incoming messages.
Otherwise, please reach out to us.
Can end users access this data?
Section titled “Can end users access this data?”Yes, end users can access the monthly report of daily energy data. Fleet site managers can view all report data. Special permission can be granted by Solar Analytics support to allow fleet owners to view more detailed reports. On the rare occasion that an end user wants high level data reporting, resellers are free to download this on their behalf.
Why isn’t a 5 seconds or minute data available?
Section titled “Why isn’t a 5 seconds or minute data available?”A typical solar site with only three channels will contain around 20,000 lines of data in our Max report in five-minute format and is a very substantial data set. Thirty second data would contain around 200,000 lines of data and is considered too large to be easily provided.
How to change the time interval for Detailed Site Data CSV file?
Section titled “How to change the time interval for Detailed Site Data CSV file?”Please follow the step by step instructions on the link here
How to best use the data on ‘Fleet Data Download’?
Section titled “How to best use the data on ‘Fleet Data Download’?”- Identify which of your customers has an active Solar Analytics Dashboard subscription that is needed so that both you and your customers can access the energy data. [Refer to Column Q: SA Subscription Status]
- “Active” shows current subscribers
- “Inactive” shows customers who were previously subscribers but no longer have a subscription or access to the Dashboard
- Understand why your “Inactive” customers do not have Solar Analytics access. [Refer to Column Q: SA Subscription Status]
- See whether your customer has cancelled their subscription, expired and not paid for a subscription, or have been deactivated
- See which customers are expiring within the next 6 weeks. [Column Q: SA Subscription Status]
- **“**Expiring” shows all customers that are completing their Prepaid Period and have been asked to take up a subscription with Solar Analytics within the next 6 weeks.
- [Column P: SA Next Renewal Date] shows when the sites will expire.
- Understand what subscription your “Active” customers are currently on. [Refer to Column M: Current Subscription Type]
- See which customers have not yet activated their accounts. [Column Z: Owner Activation Status]
- “Email activated” shows customers who have received a welcome email, clicked the link, set up a password, accepted the terms and conditions and are now able to access the Solar Analytics Dashboard and their data.
- “No email” shows customers who do not have an email address associated with their account and have never been invited to use Solar Analytics
- “Email not activated” shows customers who have received a welcome email, but have not taken any steps to activate their account. They have not accepted the terms and conditions (required in order for you to access their data) and do not have access to the Dashboard.
- Quickly and easily see fault and performance status [Column AA to AC]
- All headings now match those on the Dashboard and My Site’s List page, making it easy to see and understand fault and performance status.
- Easily find out how long a site has been with a fault status [Column AD: Fault Duration (days)]