

Why is my performance result in my Monthly Report different from the value displayed on my Performance page?
Dashboard - Performance page
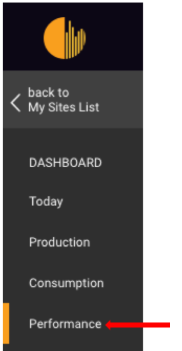
Section titled “Dashboard - Performance page”You can access the Performance page by clicking on the “Performance” tab on the left side of the dashboard.
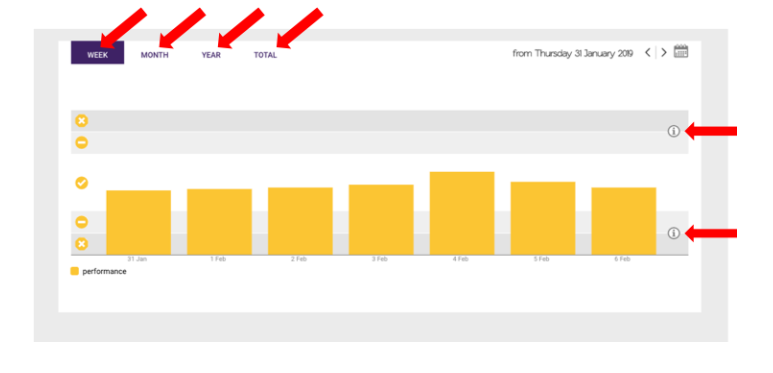
The performance percentage dial indicates how well your system is performing in comparison to what we would expect:
 = Your system is performing withinthe normal expected range.
 = Your system is performing a little bit above/below the normal expected range.
 = Your system is performing significantly above/below the normal expected range.
In the below example, data is shown on a weekly basis. You can click on the ‘MONTH’, ‘YEAR’ or ‘TOTAL’ buttons to change this.
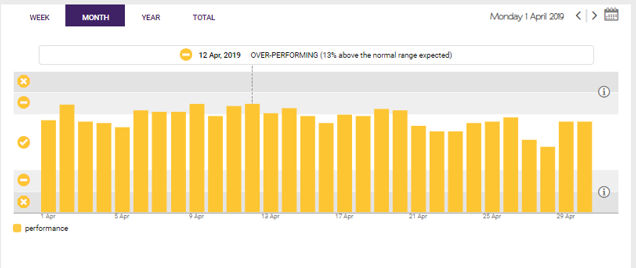
By hovering your mouse over a particular period you can see the percentage of performancerelative to what our algorithms decide is a reasonable performance range. In the example below it can be seen that on the 12th April 2019, the system was over-performing 13% more than the top of the normal range expected. This is the highest over-performing day of the month.
The Monthly Report page
Section titled “The Monthly Report page”The Monthly Report provides a summary of your site’s total system performance, production, consumption, and savings for the month. You can access the Monthly Report page by clicking on the “Monthly Report” tab on the left side of the dashboard:
For the same site mentioned in the example above we can see that for the month of April 2019, the over-performance was 119.2% compared to the expected value.
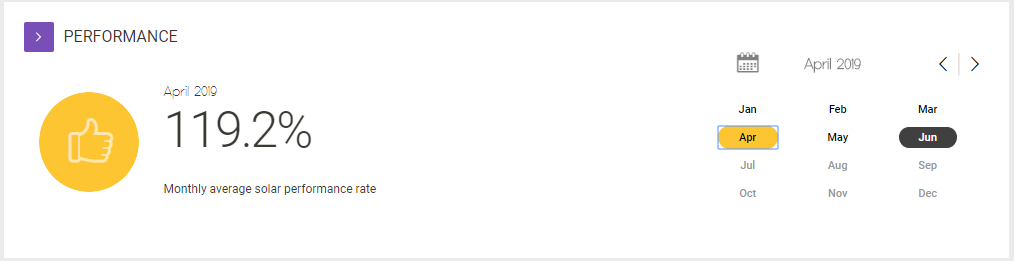
How can the monthly over-performance be 19.2% when the maximum daily over performance is 13% ?
Section titled “How can the monthly over-performance be 19.2% when the maximum daily over performance is 13% ?”There are 2 contributing factors to this:
1) The over-performance ratings on the Performance page of the dashboard are based off the upper limit of the expected range.
- The Monthly Report performance value is based only on the original expected value with no margin of error applied to create an expected range.
For example, on the 12th April 2019, Solar Analytics expects there to be 82,800 Wh of production. We then define an allowable range of approximately +/- 20%. The upper expected limit is thus 120% of 82,800 Wh which is 99,360 Wh. This value then defines the bottom of the light grey over-performance region in the performance tab.
On the 12th April 2019, production was actually 111,025 Wh. This value is ~13% greater than the upper limit of 99,360 Wh but it is 134% greater than the original expected amount of 82,800 Wh.
As the Monthly Report performance value is based on the original expected values it can exceed the maximum over-performance amount displayed on the Performance page of the dashboard. The same situation can occur in an under-performance situation.