
Why Does My Data Look Inconsistent/Unstable ?
When looking at the end result of our electrical consumption, we tend to perceive stable processes e.g. A light stays on, the fridge keeps running throughout the day, hot water (hopefully) comes out hot when we turn on a tap etc.
However what we perceive and feel doesn’t tell the full story in regards to the electrical consumption that is occurring. Grid voltages fluctuate, surge currents caused increased consumption when devices are turned on, duty cycles turn pumps and fans on & off without us noticing etc.
This combined with varying consumption patterns, changing seasons and daily weather conditions can cause our consumption to differ greatly from day to day and week to week. Similarly, a wide variety of factors can impact what your solar system is generating.
From the above considerations it can be seen that there is a benefit it not assuming things are as consistent as they seem when it comes to electrical concerns.
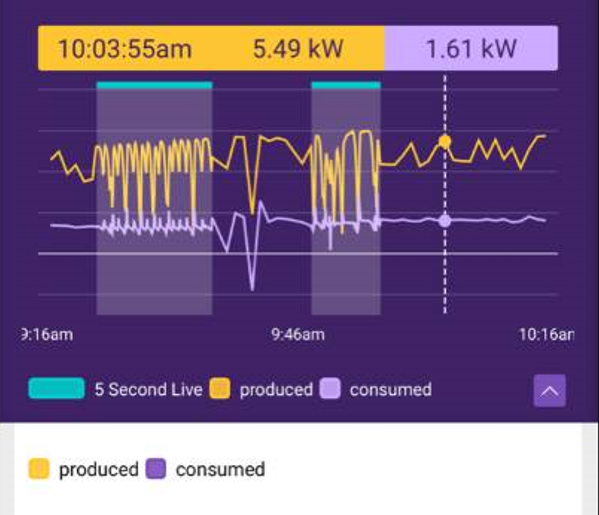
Furthermore, all these fluctuations can cause live data which can appear on timescales as small as 5 to 15 seconds to look “noisy”. It is important that all measurements contain noise within a tolerance and the data itself can vary.
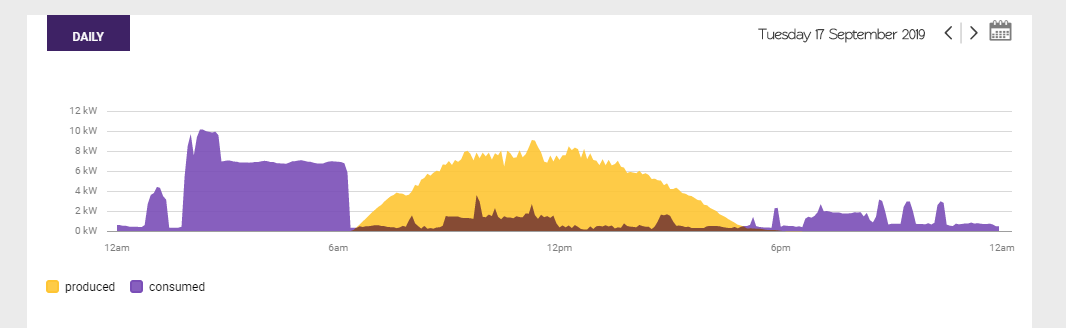
Therefore one should not expect a live data feed to have the same steady data reading found on the dashboard. This is because we process the data into a smoother trend of 5-minute interval data points on the dashboard. This can be seen by comparing the two following images:
Live Monitor - Noisy
Dashboard Display - Smoother Data