

Isolate the sub-circuits consumption
Solar Analytics dashboard has many functionalities and one of them is to isolate the sub-circuits consumption. Having this level of visibility allows you to do at least the followings:
- Identify which appliance that has been consuming the energy
- To be aware when an appliance has been operating as designed or intended
There are several ways to isolate the periodical summary of sub-circuit consumption. The data can be collected from either the dashboard or data download:
-
Dashboard
The consumption page that you have been looking at has several functionalities.
-
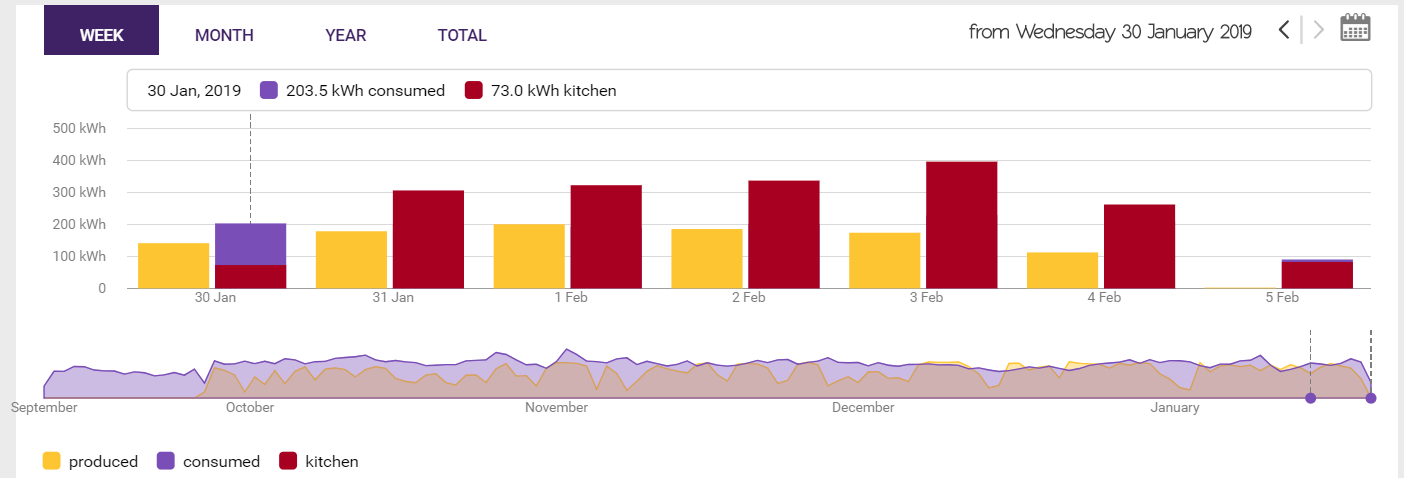
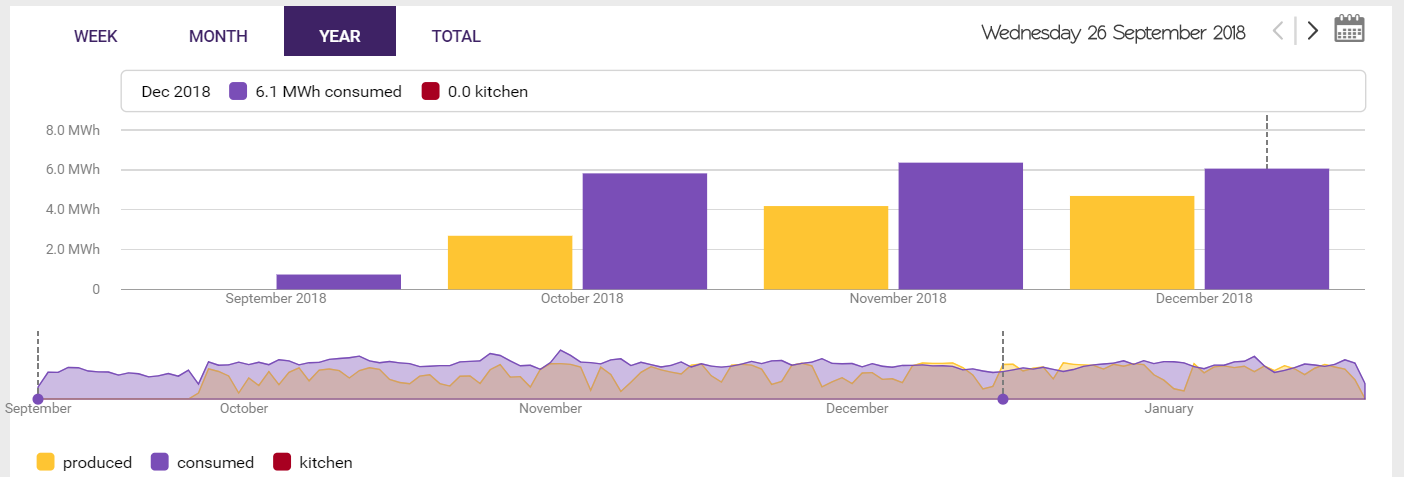
The weekly and monthly views provide a daily breakdown of the Solar Generation, Whole Site Consumption, and the sub-circuits. The yearly view provides a monthly breakdown of the Solar Generation, Whole Site Consumption, and the sub-circuits. Depending on how many/long data that you have on Solar Analytics database, the total view will/should provide you with either the monthly or annual breakdown of the Solar Generation, Whole Site Consumption, and the sub-circuits. All you need to do is to hover the mouse above the consumption graph. Please refer to the images below.
-
-
Data Download
There are two types of Data Download that are useful for getting the summary of the sub-circuits consumption.
-
Daily Sites Data
Daily sites data download provides a CSV file consists of a daily breakdown of the Solar Generation, Whole Site Consumption, and the sub-circuits (if applicable). Please refer to the image below for a sample of Daily Sites Data with sub-circuits.
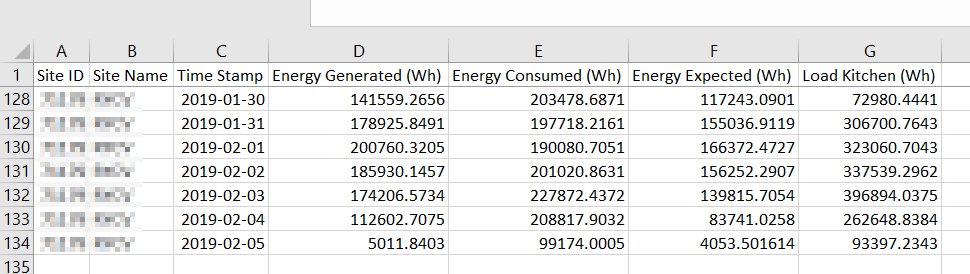
The data is useful to get daily consumption profile of the sub-circuits load.
-
Max Site Data
Max Site Data provides a CSV file consists of a 5-minute resolution of energy data per circuit of your Solar Analytics device(s). Below is an example of a max site data from a site that has six different channels in total. Please refer to the image below.
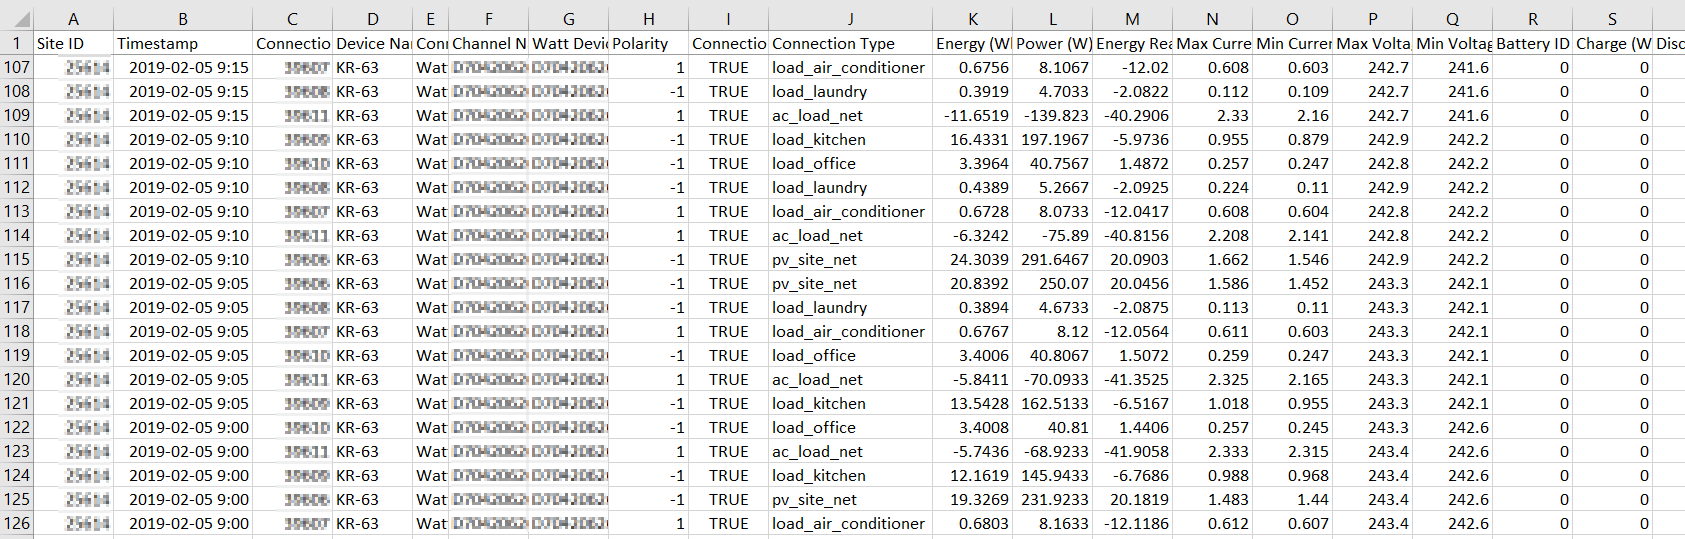
A bit of excel skill such as Pivot Table will be useful in processing the 5-minute resolution data.
-
Please leave a comment if you have any questions.