

How do I compare my electricity bill to my Solar Analytics Dashboard?
To compare your electricity bill to your Solar Analytics Dashboard, look for two key values:
- Electricity Used - the total kilowatt hours of electricity you have imported from the grid (you might have a flat rate with one figure like the image below, or you might have peak, off-peak and shoulder rates that you can add together to get a usage total).
- Solar Exported - the total kilowatt hours of solar that you have exported to the grid (usually noted as a Solar FiT or feed-in tariff)
Example from an Energy Locals bills below:
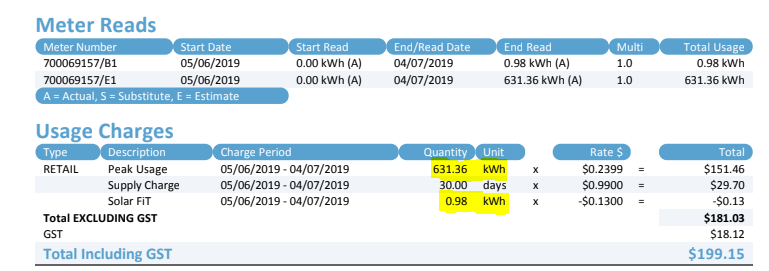
You can then compare those figures to the actual values on your Dashboard.
Go to your ‘Consumption’ page and enter in the ‘from’ and ‘to’ dates and click ‘update’:
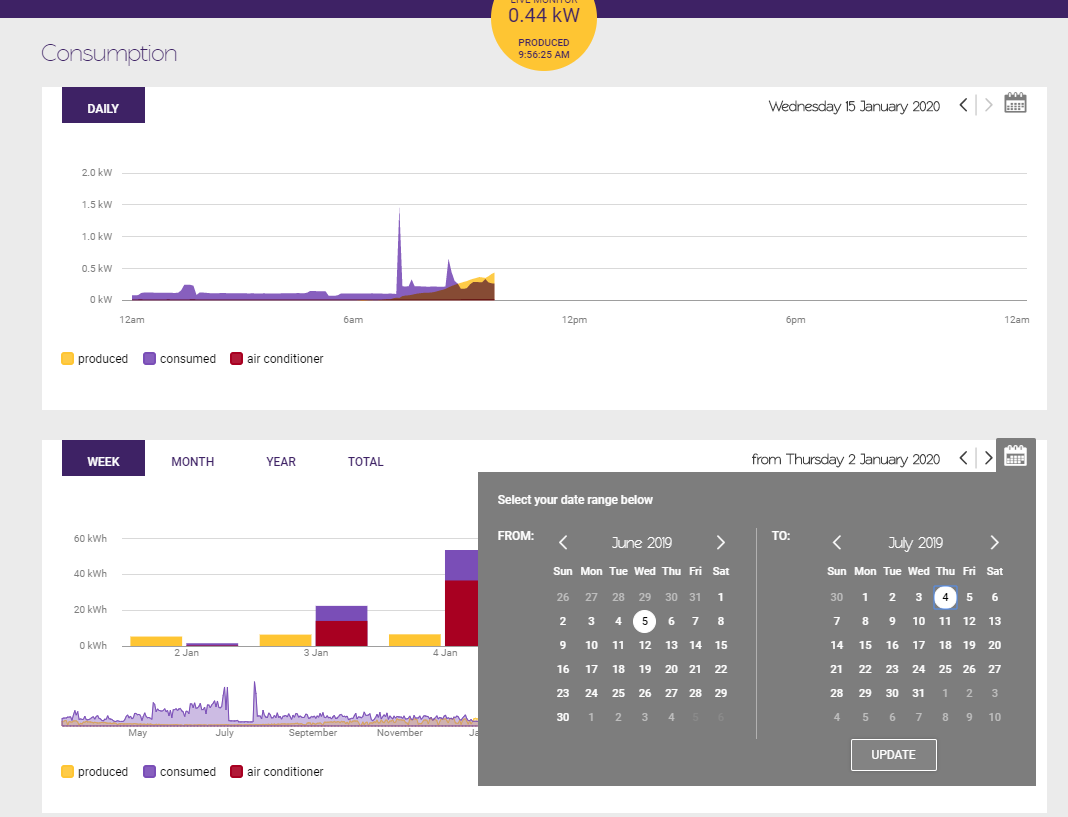
Scroll down a little and you’ll see the figures that you can compare with your bill:
- Energy imported from the grid
- Solar exported to the grid
You’ll notice that these figures are ever so slightly different, and that’s because your Solar Analytics device is reporting exactly what you are using as of midnight on those dates, however the electricity company may be reading the meter manually on a different day and averaging out usage, or reading the meter remotely if you have a smart meter, and the reading may not be exactly at midnight. But the two values should be very close, as per this example.For more detailed instructions, please see our Blog Post about this topic: How to check if your electricity bill is accurate, using Solar Analytics